
Road safety assessments involve the observation of a street to determine whether design elements contribute to a safe environment for pedestrians, cyclists, motor vehicle passengers, and other road users.
Star Rating for Schools
The International Road Assessment Programme (iRAP) Star Rating system is used to judge the road safety performance of highway corridors and is widely used in various contexts to carry out safety audits for existing and proposed highways. The rating system assigns a star rating to road segments based on a combination of safety metrics, with the least safe roads rated as 1-star and the safest as 5-star.
The iRAP system has been customised for use in evaluating safety in school zones. The Star Rating for Schools combines an easy-to-use School Assessment tablet app and a Global Reporting for Schools web application to enable users to measure the risk to which children are exposed on their journey to school. Based on the information provided, the app suggests road safety treatments that can help improve safety for children.
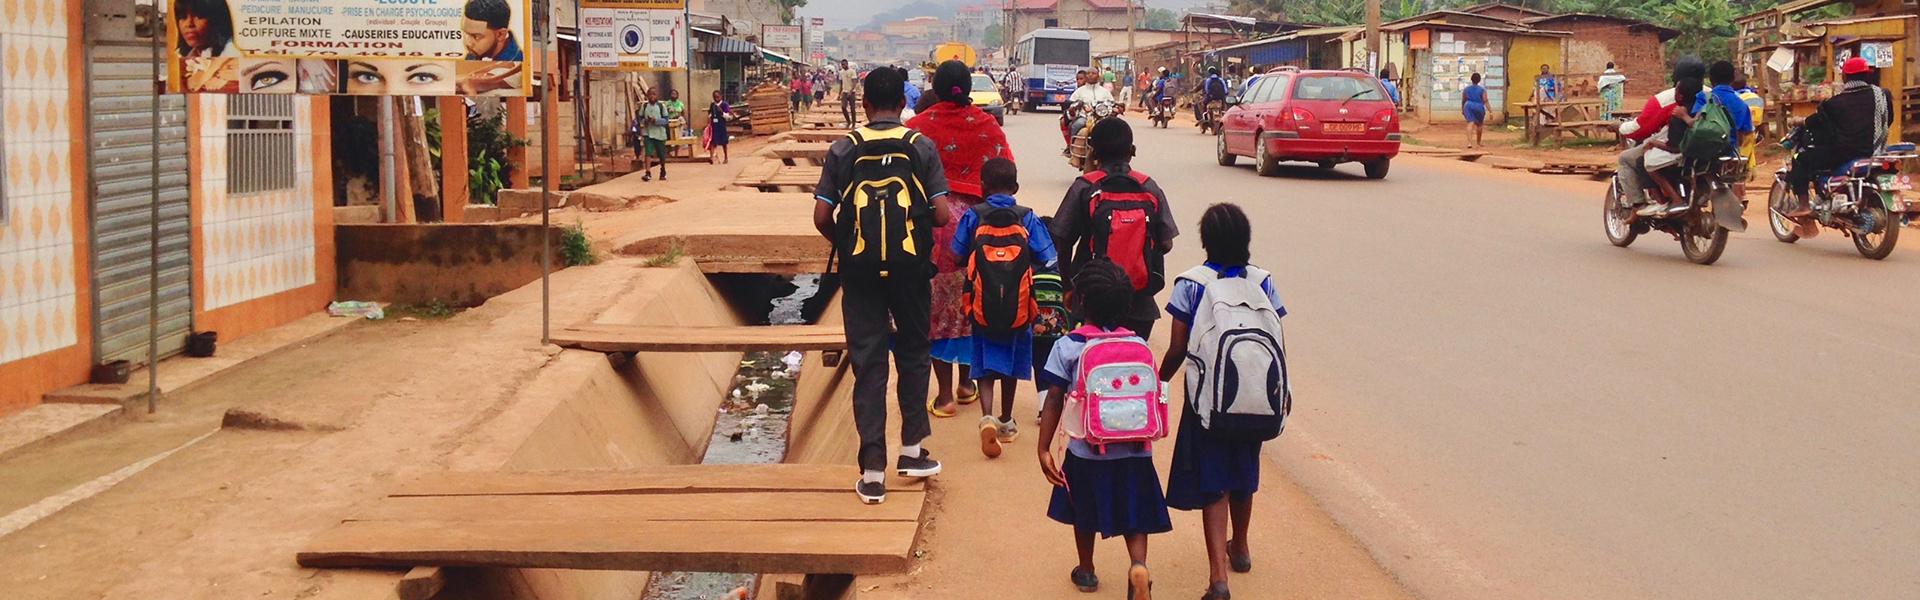
Walkability is a measure of how friendly an area is to walking. Children in African cities typically travel by walking and a safer pedestrian environment is critical to improving children’s mobility. Participatory evaluations can be powerful tools to bring together community members and develop a shared approach for addressing mobility challenges. Walkability assessments typically evaluate the following:
- The presence of high-quality footpaths.
- The presence of safe, signalised pedestrian crossings.
- Elements that contribute to pedestrian comfort and convenience, such as shade and street furniture.
- Factors affecting personal security and safety, such as street lighting.
Many templates and tools for assessing the walkability of streets and neighborhoods are readily available. Examples include:
- Pedestrian Environment Quality Index: Developed by the San Francisco Department of Public Health, the Pedestrian Environment Quality Index (PEQI) covers numerous aspects of the pedestrian environment, across five domains: intersection safety, traffic volume, street design, land use, and safety. The PEQI has been applied in a number of cities in the United States, including Denver, Los Angeles, Portland, and Pittsburgh.
- Built Environment Assessment Tool: The Centers for Disease Control created the Built Environment Assessment Tool (BEAT) to evaluate elements of the built environment that encourage walking, cycling, and other forms of active transport. The BEAT includes a lengthy and detailed survey covering specific elements of intersection design, street segment design, and built form.
- Asian Walkability Index: Inspired by the Global Walkability Index, a resource conceptualised as part of a World Bank research project, the Clean Air Asia Walkability Index was designed as a field survey tool to conduct a rapid assessment of the pedestrian environment in South and East Asian cities. The tool emphasises factors that are relevant in the Asian context, including footpath encroachments, driving behaviour, footpath maintenance, and the ease of crossing.
- ITDP Street Design Audit form: Streets require a high-quality pedestrian environment to meet the needs of children who travel by foot. The audit notes footpath presence and condition, the level of pedestrian activities, vendor presence, on-street parking arrangements, footpath obstructions, pedestrian crossing presence, availability of shade, and street furniture.
Neighborhood audits review the quality of facilities within a 10- to 15-minute walk from a school or residence. Using the school as starting point, a participatory needs assessment process can organize students in groups and ask them to evaluate their “15-minute neighborhoods.” It is important to recognize that needs significantly differ by age group, as teens and toddlers need very different types of built environment features. Thus, the needs assessment process should be completed by children as well as family members and caregivers for younger children. The assessment can consider the following factors:
- Facilities: Presence of schools, active green space, playgrounds, child-friendly facilities and businesses.
- Housing Density: Higher residential densities are often associated with high walking mode share.
- Land Use Mix: A mixture of land uses enable people to easily walk, bike or take public transport between different activities or destinations such as home, workplace, and shops.
- Street Connectivity: Intersection density (the total number of intersections per square km) has shown positive correlation to adolescent walking rates.
- Safety/Security: Perceptions of neighborhood safety/security and provision of pedestrian lighting.
- Walkability: Provision of safe (and accessible) sidewalks and other pedestrian infrastructure.
- Cycling: Provision of safe bicycle facilities.
- Transit: Provision of public transit services (including frequency) and public transport ridership.
- Traffic Violence: Number, location and description of traffic crashes, especially those involving children, seniors, people with disabilities, pedestrians, and bicyclists.
- Traffic volumes: Traffic volumes on local streets and arterials, including pedestrians, cyclists, and public transit users as well as motorized vehicles.
Case study: the Neighborhood Environment Walkability Scale (NEWS)
Developed in 2002, the Neighborhood Environment Walkability Scale (NEWS) assesses residents’ perception of neighborhood design features related to physical activity, including residential density, land use mix (including both indices of proximity and accessibility), street connectivity, infrastructure for walking/cycling, neighborhood aesthetics, traffic and crime safety, and neighborhood satisfaction.
This framework was adapted to the needs of seven African countries: Cameroon, Ghana, Kenya, Mozambique, Nigeria, South Africa and Uganda, and was deployed in villages of six of the seven participating countries. The NEWS scale was subsequently adapted to focus on the mobility concerns and challenges for children and parents, and became the NEWS-Y scale.
Focus groups involve asking children for their opinions, which can be powerful because it gives designers or engineers a firsthand account from the intended target group for the interventions. This information can be invaluable in creating the safe environments and interactions that will help children thrive.
Before the focus group:
- For the most effective sharing, studies suggest groups of four to six kids work the best. Wide age discrepancies may create barriers to active participation.
- Consider how to recruit a diverse group that represents the demographics intended beneficiaries.
- Ensure inclusivity so opinions from children of various abilities, interests, and backgrounds are part of the process.
- Set an approachable, warm and non judgement tone as the moderators.
- The children should be aware that their participation is voluntary, and that they do not have to take part in the activities or answer any questions that they do not want to.
During the focus group
- Start the session with a fun activity or game to help the students relax and get to know the moderator.
- Consider alternative seating arrangements, such as seating in a circle, to inspire an inclusive environment and also enable for interaction.
- Explain the purpose of the focus group and give a personal introduction about your role in the school or community.
- Set clear group rules and ask participants to contribute to a community agreement. Communicate to the children that there are no right or wrong answers.
- Since some students may be shy to speak up in a group setting, include other options for participation, such as writing ideas on a slip of paper to hand in at the end of the focus group.
- Keep an eye on participants’ energy levels.
Case study: Neighborhood assessment in Khayelitsha, Cape Town
A participatory planning exercise was organised at Iqhayiya Secondary School in Khayelitsha, Cape Town. Five AO maps of the neighbourhood were printed and provided to the students with a range of stickers and marker pens in different colours. The students were tasked with tracing the routes that they take to school using the marker pens. The students were given green stickers to identify their school, and any other schools that they needed to visit for additional lessons or to accompany a sibling during their commute. Finally, the students were asked to identify places along their route to school with red stickers in which they encountered an obstacle, hindrance, or unsafe situation. Any additional information about commuting challenges could be written next to stickers.
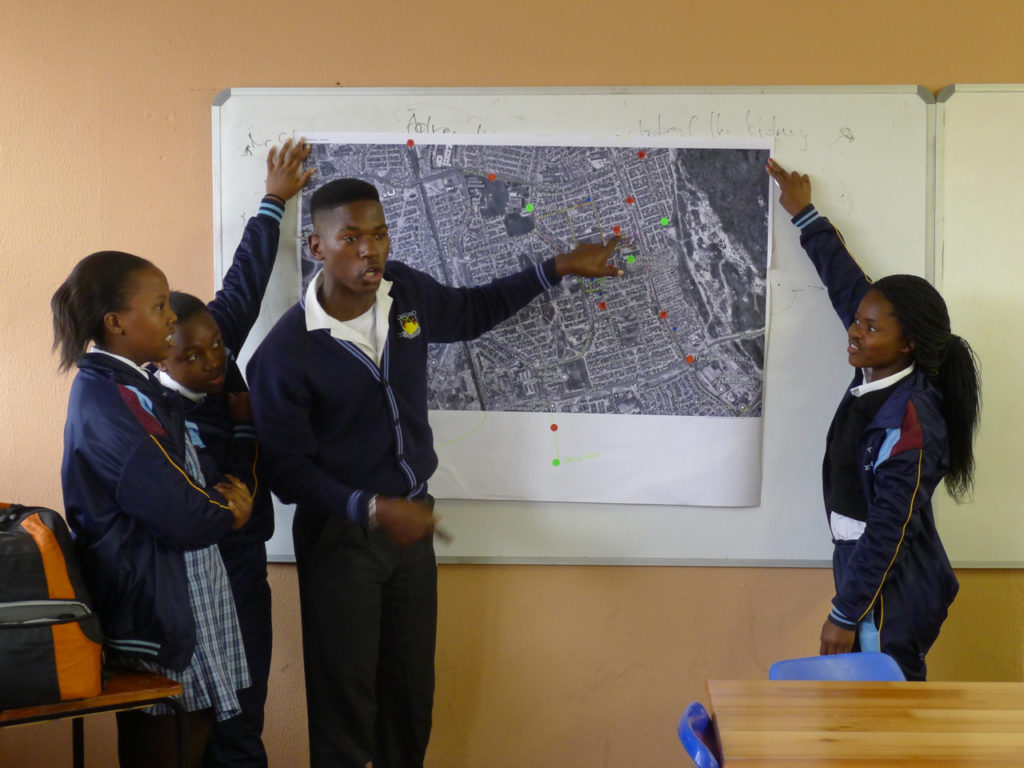
The students were asked to hold up their maps in front of the class, group by group, and explain their lived experience of travelling to school. It was evident that most students walk to school, with a few using paratransit or commuter trains.
- ]
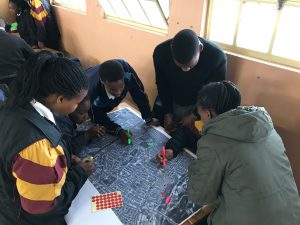
Mapping of routes to school.
The largest surprise for the project team was the magnitude of physical danger that the students encounter on their daily commute, especially due to criminal activity. If the drug lords had not sold enough product during the day, they would try to rob the students during the evening commute. In addition, if the students passed an area of gang activity, they would be bullied with the intention of them skipping school to be initiated into the gang. The minibus taxis were also highlighted as dangerous due to their hazardous driving on arterial roads and battles over operating territories. Most of the perpetrators are known to the parents and community, but they are too afraid to report the criminal activity to the authorities.
After the groups had presented the dangers that they encounter, we initiated a discussion around how the students think these problems may be solved. A more prominent police presence was one of the most common solutions offered. Increased street lighting and the establishment of dedicated ‘safe routes’ were also proposed. To reign in the behaviour of drivers, more pedestrian crossings and camera enforcement for the crossings were requested. Finally, it was suggested that the Society for the Prevention of Cruelty to Animals be called in to teach neighbours about the dangers of allowing dogs to roam the streets around schools.
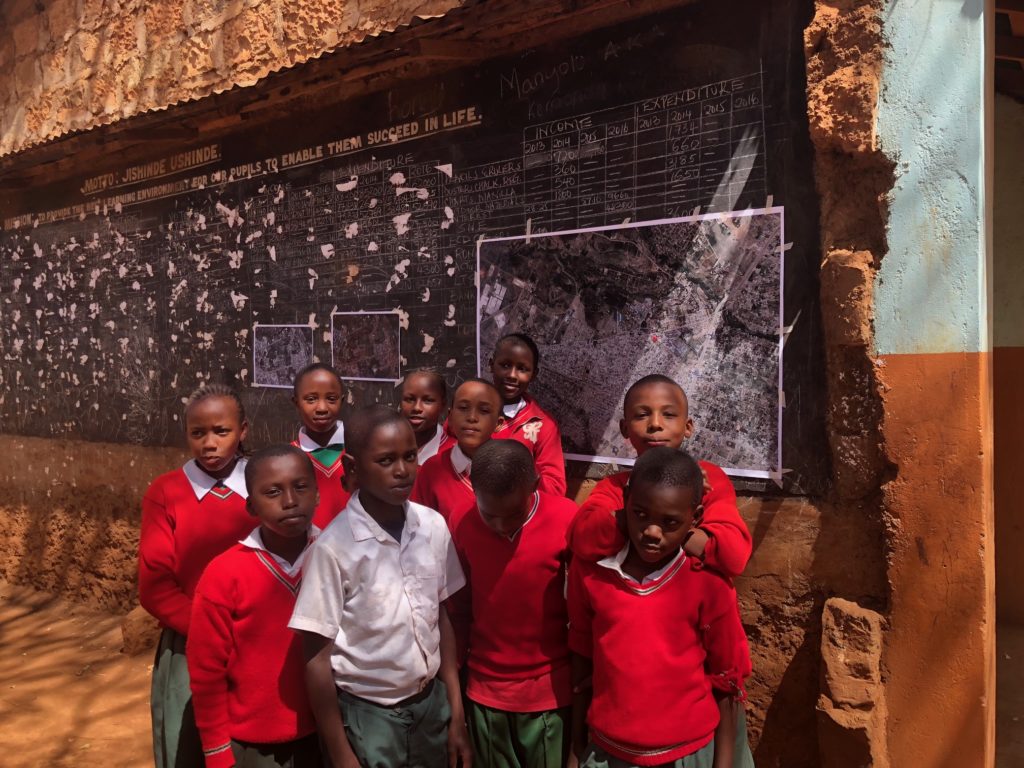
Case Study: Needs assessment in Ruiru, Kenya
An engagement with children was conducted on 20 Feb 2018 at St. Georges Primary School in Ruiru Town, Kenya, with standard 7 and 8 students aged 10-12. St. Georges Primary School is a public mixed primary school run by the Catholic Church. Ruiru is a town of 240,000, located within the Nairobi metropolitan region. The children commute to school mostly on foot.
Two A0 maps covering a 5 km radius from the school were printed. Fifteen students chosen from each class were given marker pens, smiley faces stick notes, and sticky notes with numbers on them. The guiding questions were:
Identify the school on the map
Trace the route taken to and from school
Identify the areas where they feel insecure
All the students walked in groups, picking each other from homes along the way. The main challenge in commuting to school involved crossing the roads. The school and the residential community is separated by the Ruiru Kamiti Road, a 6 m road. The children cross the road at two points: Spinners and Devki Steel Millers. The students identified the need for better signage and traffic calming measures right outside the school premises and safer crossings at Devki Steel Mills and Spinners.
Photovoice is a fun activity for kids in which students can use photography to document safety issues in their neighborhood. One approach involves using two picture frames to capture positive and negative elements of the environment. Kids hold up a green frame and snap a picture of things they like, and then frame with a red frame things they don’t like in the built environment.
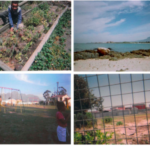
Case study: Children’s representations of nature in Western Cape, South Africa
A study in the Western Cape, South Africa, explored children’s perceptions of natural spaces using the photovoice method and community mapping. The sample consisted of 28 children ages 12–14 years residing in urban and rural communities. Data were collected through six focus groups: three photovoice groups and three community mapping groups. For the photovoice discussions, children were provided with a disposable camera and given one week to complete their missions. Thematic analysis was employed to analyse the data. Socioeconomic status was found to be a determining factor in how children make sense of natural spaces. Children from low socioeconomic status communities indicated being more constricted in their mobility, and were unable to access to safe natural spaces compared to the children from other communities.